Building Moneyball for Valorant: Why I Built a Data Layer, Not an AI
"It's about getting things down to one number. Using stats the way we read them, we'll find value in players that nobody else can see." — Peter Brand, Moneyball
How I approached the Cloud9 x JetBrains Hackathon with a pragmatic philosophy: let the best AI be Peter Brand.
The Scene That Started It All
There's a scene in Moneyball that every data person remembers.
Billy Beane is sitting across from his scouts, listening to them debate which players "look" like winners. Then Peter Brand walks in with a laptop and says something like: "The data says you're wrong. Here's who you should actually draft."
That scene isn't about the laptop. It's not about the spreadsheet. It's about having someone who can translate raw numbers into decisions.
Peter Brand wasn't a dashboard. He was an interpreter — someone who understood both the math and the game deeply enough to say, "This player is undervalued. Sign him."
When I saw the Cloud9 x JetBrains Hackathon and read the Category 1 prompt — "A comprehensive Assistant Coach powered by Data Science and AI, inspired by Moneyball" — I knew exactly what I wanted to build.
Not a dashboard. Not a custom AI model.
I wanted to build the data foundation that lets a Peter Brand-level analyst work.
And in 2025, the best Peter Brand available is Claude.
How I Got Here
It was New Year's break, and I was looking for a fun side project.
I play Valorant. I'm also an analytics engineer by profession. And I've been using AI tools since Gemini was still called Bard. So when I stumbled across GRID's esports data API while browsing Valorant analytics resources, something clicked.
Then I found the Cloud9 x JetBrains Hackathon — and realized I could get access to official VCT data just by signing up.
So here I am.
What started as a "let's see what's in this data" weekend project turned into a full analytics modeling layer. Turns out, when you give an analytics engineer access to rich event data and a long weekend, things escalate quickly.
The Architecture: Data, Peter Brand, and the Coach
Here's how I think about the Moneyball parallel:
| Moneyball | VLML |
|---|---|
| Baseball statistics | VLML Analytics Model (DuckDB) |
| Peter Brand | Claude (via MCP) |
| Billy Beane | The Coach (user) |
The data layer is the foundation. Pre-computed metrics at every grain: round, game, series, player, team. Opening duels, trade rates, KAST, clutch performance, economy patterns — everything a coach would want to ask about, already calculated and waiting.
Claude is the interpreter. Connected via MCP (Model Context Protocol), Claude can query the analytics model, reason over the results, and have a real conversation with the coach. Not just "here's a number" — but "here's what this number means for your next match."
The coach is the decision-maker. They ask the questions, challenge the analysis, and ultimately decide what to practice.
• Interprets results
• Explains patterns
• Suggests VOD review priorities
• 70+ pre-computed metrics
• Optimized for coaching questions
Being Pragmatic About AI
Early in this project, I had to make a decision: build a custom model or use what's already best?
I chose the second option. Here's why.
Frontier models like Claude, ChatGPT, and Gemini are trained on trillions of tokens with billions of dollars of compute. They understand language, reasoning, context, and nuance at a level that no domain-specific fine-tune can match.
What they don't have is access to structured Valorant esports data. That's the gap.
The smart play isn't to compete with Anthropic or OpenAI on the AI side. It's to build the data infrastructure that makes their AI useful for coaching.
Think of it this way:
- Fine-tuning a model = Teaching someone a new skill from scratch
- Connecting a model to the right data = Giving an expert the information they need
A fine-tuned model knows Valorant terms but can't access real match data. Claude connected to VLML knows everything — because it can query the actual numbers.
The data layer is where I can add value. The AI layer is where I should ride the wave.
The pragmatic choice is clear: build the data layer, use the best AI available.
Today, that's Claude with MCP. Tomorrow, it could be Gemini 3.0, GPT-5, or whatever model leads the pack. The architecture is model-agnostic by design.
This isn't a limitation. It's a feature.
Why Claude Right Now?
If the architecture is model-agnostic, why am I using Claude specifically?
One reason: MCP integration.
MCP (Model Context Protocol) is a standard that Anthropic released in late 2024. It lets AI models connect directly to external tools and data sources — databases, APIs, file systems — in a structured, secure way.
As of today, Claude is the only frontier model with first-class MCP support built into its desktop client. You connect your MCP server, and Claude can call your tools natively. No custom glue code. No API wrappers. Just a clean connection between the AI and your data.
Other models will catch up. OpenAI, Google, and others are all working on similar tool-use protocols. When they do, VLML will work with them too — that's the point of building on an open standard.
But right now, Claude + MCP is the best experience for building a conversational AI assistant that needs structured data access. That's why I'm using it.
The Sky Is the Limit: Junie + IDE Integration
Here's where it gets exciting: MCP isn't limited to Claude Desktop.
JetBrains recently released Junie — their AI coding assistant with full MCP support. That means VLML works directly inside your IDE.
For data people who live in their development environment, this is a game-changer. You can run coaching analysis, query the database, and generate insights — all without leaving your editor.
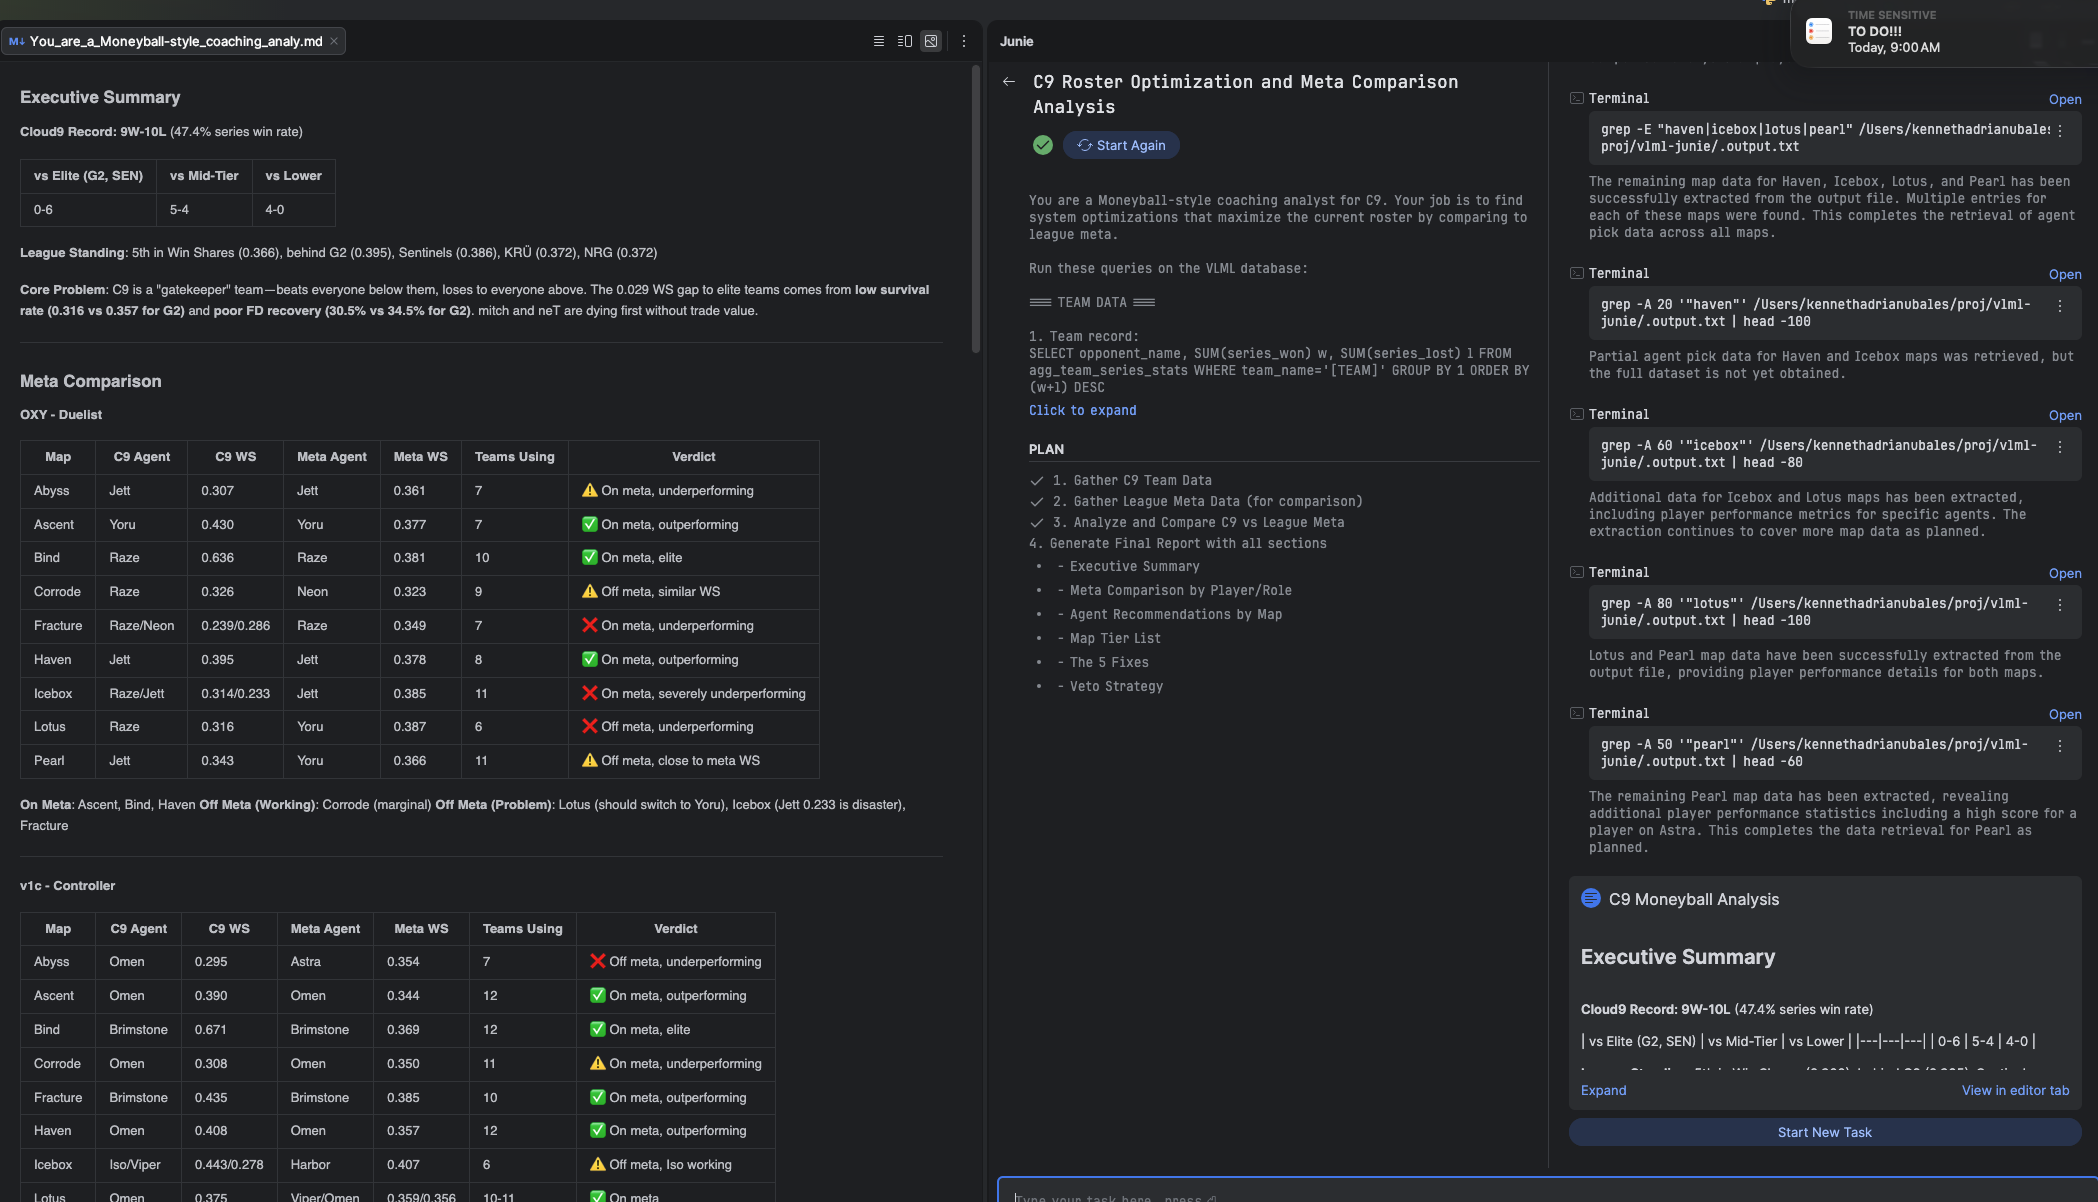
In this example, Junie is running a full C9 roster optimization analysis — pulling map data, comparing agent performance, and generating strategic recommendations. All inside the IDE, all powered by the same VLML data layer.
This is the power of building on open standards. Today it's Claude Desktop and Junie. Tomorrow it could be:
- VS Code + GitHub Copilot with MCP support
- Custom team dashboards built on the same data layer
- Mobile coaching apps that query VLML remotely
- Automated scouting pipelines triggered before each match
The data model is the foundation. The sky is the limit for how you access it.
What I Actually Built: VLML
VLML (Valorant Analytics Modeling Layer) is a structured data model for professional Valorant esports analytics.
The Data Pipeline
Raw data comes from GRID's official esports API — the same data source used by VCT broadcast teams. The pipeline:
- Ingests raw JSON event data (kills, deaths, abilities, economy, etc.)
- Transforms events into a normalized schema (series → games → rounds → events)
- Aggregates metrics at multiple grains (player-round, player-game, team-round, etc.)
- Exposes everything via MCP for AI access
The database is DuckDB — fast, embedded, and perfect for analytical queries.
A note on data access: Huge thanks to GRID for providing official esports data through their API. Currently, I have access to VCT Americas data, which powers all the examples in this post. If GRID ever expands access to include VCT Masters, Champions, Pacific, and EMEA data — that would unlock even deeper cross-region analysis. (Consider this my formal request. 😄)
Also — a thought for GRID: I come from the ecommerce industry, where almost every major app and platform now has their own MCP server. Shopify has one. Stripe has one. It's becoming the standard way to let AI tools interact with structured data. GRID is sitting on some of the richest esports data in the world — an official GRID MCP server could be a game-changer for the entire esports analytics ecosystem.
The Metrics
Every metric a coach might care about is pre-computed:
| Category | Metrics |
|---|---|
| Opening Duels | First bloods, first deaths, FB conversion rate, FD salvage rate |
| Trading | Trade kills, untraded deaths, trade window timing |
| Impact | Multi-kills (2k, 3k, 4k, ace), clutch attempts and wins |
| Consistency | KAST%, ADR, kill participation |
| Economy | Pistol win rate, eco rounds, thrifty conversions |
| Agent/Map Splits | Performance by agent, by map, by side |
These aren't just raw counts. They're coaching-ready metrics — the same numbers a professional analyst would calculate manually, but available instantly.
The MCP Tools
The server exposes insight tools, including modular match reports:
match_analysis_report— Post-match breakdown: team comparison, player performance, round timeline, VOD priority queuematch_summary_report— Lightweight overview: metadata, team comparison, benchmarksmatch_players_report— Player-focused: performance, KAST, highlightsmatch_rounds_report— Round-by-round with pagination supportmatch_economy_report— Economy cascade and attack patternsplayer_profile_report— Individual player assessment: career stats, agent/map splits, recent form, clutch performancescouting_report— Pre-match opponent prep: map pool, roster tendencies, strategic patternspattern_detection_report— Identify recurring issues or strengths across many matches
Plus two database tools for ad-hoc analysis:
query_sql— Run any SELECT query directly on the analytics tablesget_database_info— Explore what data is available
The tools return data only — structured metrics with no narrative. The AI generates the insights, recommendations, and explanations based on the numbers.
The Coaching Experience
Here's what it actually looks like to use VLML in a real-world scenario: a post-match review after Cloud9's playoff loss to NRG.
Instead of a dashboard, the coach starts a conversation. They ask for an agenda, and Claude calls match_analysis_report to synthesize the data into a prioritized checklist.
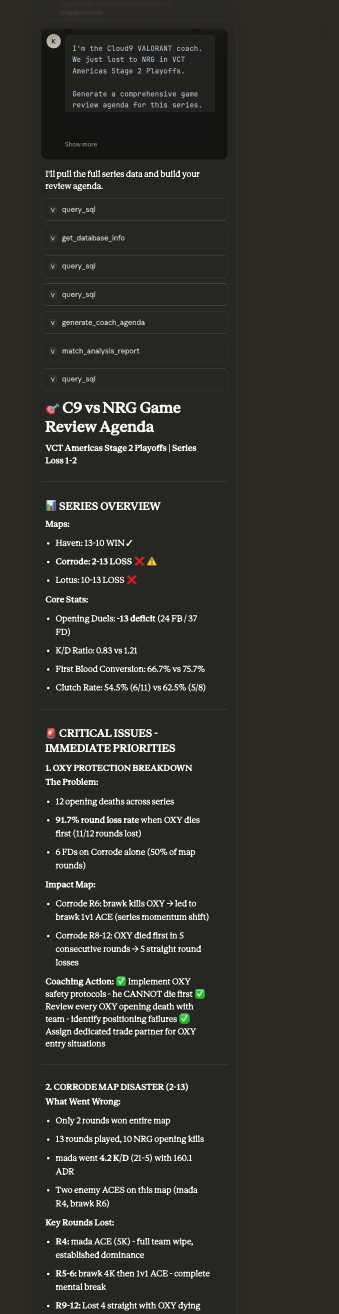
In seconds, the AI identifies the statistical "why" behind the loss. It doesn't just show kills; it flags that when OXY dies first, C9 loses 91.7% of their rounds. That's an immediate, actionable coaching point that would normally take hours of VOD review to quantify.
Micro-Level Tactics & "What If" Analysis
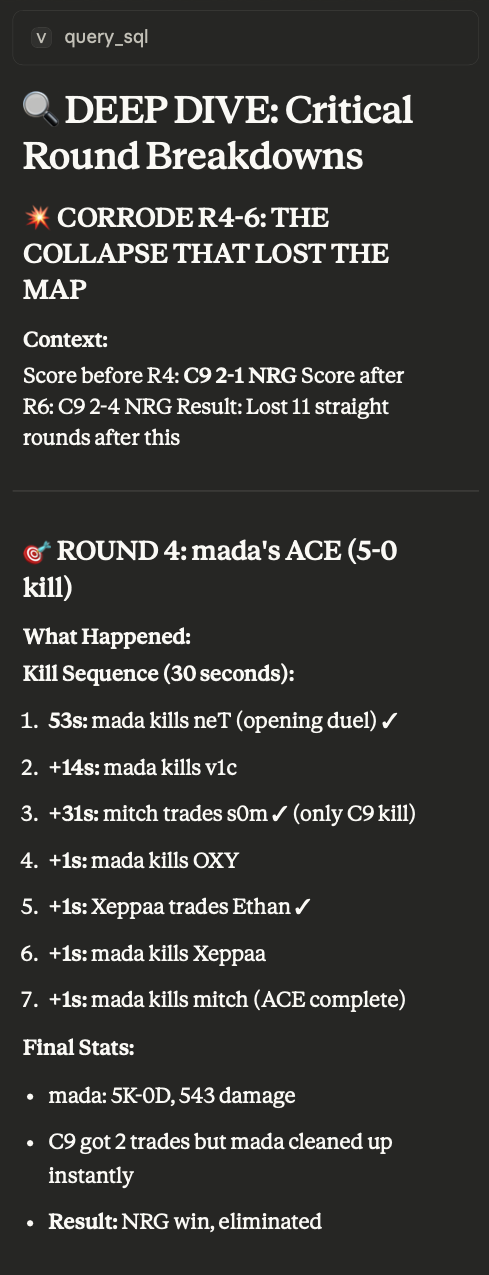
The conversation doesn't stop at the series level. The coach can drill down into a specific map, or even a specific round that felt like a turning point.
In this example, the AI performs a deep dive on Corrode Rounds 4-6 — three consecutive round losses that shifted momentum. It analyzes mada's ACE in Round 4, breaking down the kill sequence to the millisecond.
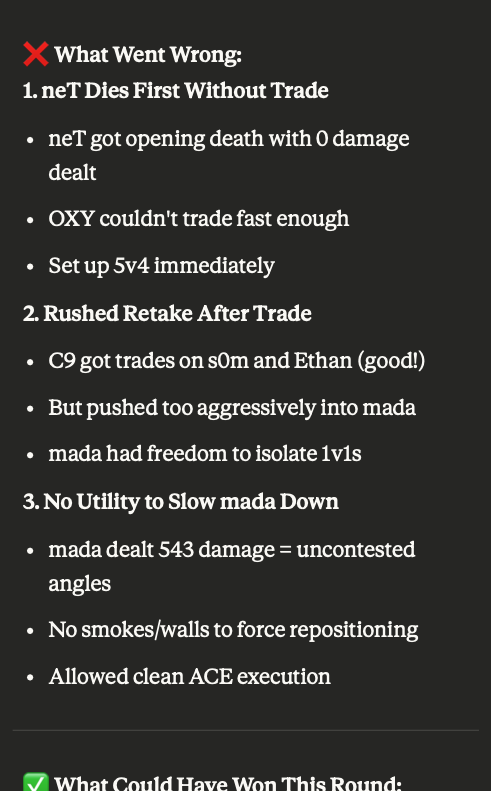
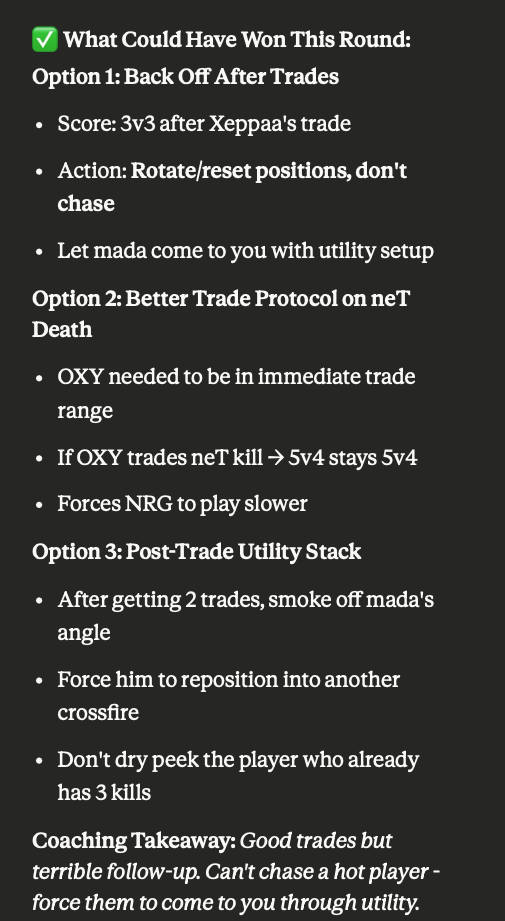
Most impressively, it identifies three "What Went Wrong" failures — late rotate, spacing collapse, and predictable aggression — then offers three "What Could Have Won" alternatives. It moves from being a "stat bot" to a "coach," suggesting specific protocols like early rotate calls and trade positioning. This is the "Moneyball" promise fulfilled: turning data into a winning process.
Why Conversational > Dashboard
A dashboard answers the questions you already know to ask.
A conversation discovers the questions you didn't.
When I started this project, I considered building a traditional analytics dashboard. But I realized that the most valuable coaching insights come from follow-up questions:
- "Why did Round 8 go differently than Round 3?"
- "Is this a trent problem or a team structure problem?"
- "What would you practice to fix this?"
Those aren't queries you can pre-build into a dashboard. They emerge from context — from understanding the specific situation and asking the next logical question.
Claude, connected to the right data, can handle that. A dashboard can't.
The Memory Advantage
There's another reason conversational AI beats static dashboards: memory.
Every time I use Claude with VLML, it learns more context about how I think, what questions I care about, and what patterns matter to me. The analysis gets better over time — not because the model is fine-tuned, but because the conversation has more context.
This is something you can't replicate with a custom model or a one-shot API call. The long-running relationship between coach and AI assistant is part of the value.
The Right Person Still Matters
Here's the thing about Moneyball that people often forget: Peter Brand didn't replace the scouts. He changed how they evaluated talent.
The same is true for AI coaching assistants. Claude doesn't replace the coach — it augments them.
The AI can surface patterns, crunch numbers, and generate hypotheses. But someone still needs to:
- Know which questions to ask
- Understand the context of why a player made a decision
- Translate insights into practice drills and game plans
That's the coach. And if you're an esports organization, you already have this person — your coaching staff has the game knowledge and context that makes AI insights actionable.
VLML isn't trying to replace that expertise. It's trying to give it superpowers.
What I Learned
Building VLML taught me a few things:
- The data model is the product. Anyone can call an API. Few can build the right analytics schema that makes AI responses actually useful.
- Pre-compute everything. Raw events are noise. Coaches need answers, not 10 million rows to query.
- MCP is powerful — and portable. Connecting structured data to AI via MCP feels like magic. And because it's an open standard, the same data layer works with Claude, Junie, and whatever comes next.
- Be pragmatic about AI. Fine-tuning is expensive and gets outdated. Riding the frontier model wave is the smarter play.
- Conversation > Dashboard. The most valuable insights come from follow-up questions that emerge in dialogue.
- Meet users where they are. Some coaches want a chat interface. Some analysts want an IDE. MCP lets you serve both with the same data layer.